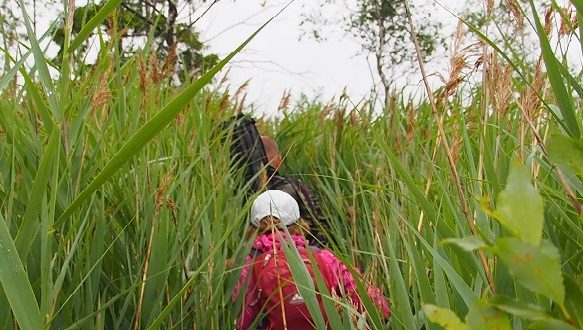
Project team from Tallinn University completed vegetation analyses on their large (over 3000 hectares) restoration site at Suursoo – Leidissoo fen complex. Vegetation analyses were made on 14 transects crosswise ditches, each 200 to 500 metres long. The length of transect and the number of study plots on transect depends on vegetation pattern. On one transect, four to six study plots established by 10 x 10 metres where tree and shrub layer parameters (species, stem diameter, height, and coverage) estimated. Every plot had 3 subplots by 2 x 2 metres in four quadrates (1 x 1 m) for grass layer analyses and 36 small subplots (0.25 x 0.25 m) for surface layer analyses.
Collected database contains data of 69 analyses for tree and shrub layer, 207 analyses for grass layer from 2 x2 metres, and 828 analyses from 1 x 1 metres plots, and 2484 surface layer analyses. Analyses covered different vegetation types from well preserved or drained fen to shrubbery and drained forests. Parallel to it, water pH and electrical conductivity measured.
Further steps in field studies will be installation of water level fluctuation divers, taking surface peat samples from the depth of 0-10 cm and 10-20 cm depth for laboratory analyses (bulk density, ash, N, P, Ca, Mg, Fe content will be estimated), and greenhouse gas measurements. This all gives information about present status of vegetation on the project area, but also allows us to estimate the changes after the re-wetting of the area.
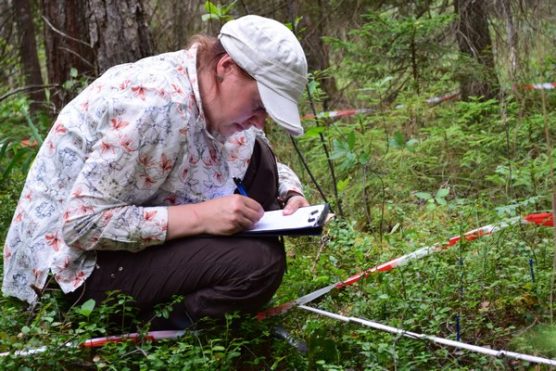
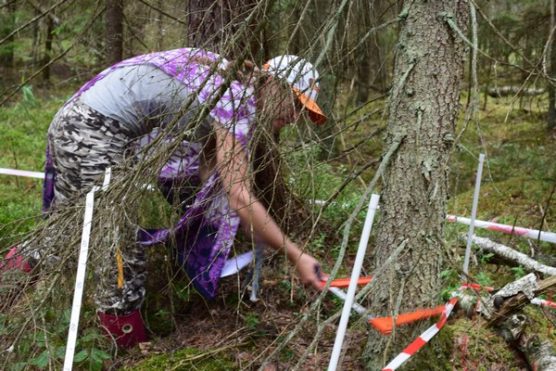
Surface layer analyses, and tree diamater measurements at drained forest site. Photos: Laimdota Truus
As the area is too big to be covered with dense analyse network, drone photos were taken. Later, the combination of vegetation analyses and information gathered with drone photos will be used for generalization and mapping the vegetation types. Photos made with multispectral camera can give information about plant biomass distribution on area, etc.
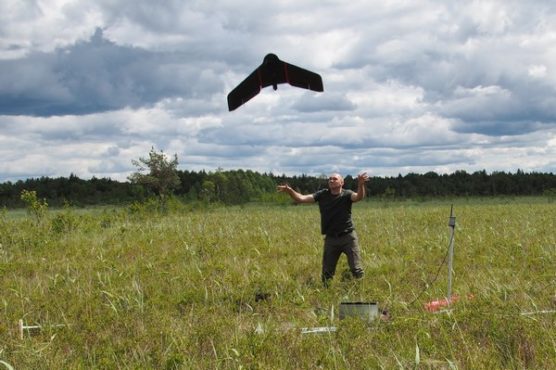
Sending drone to flight. Photo: Kairi Sepp
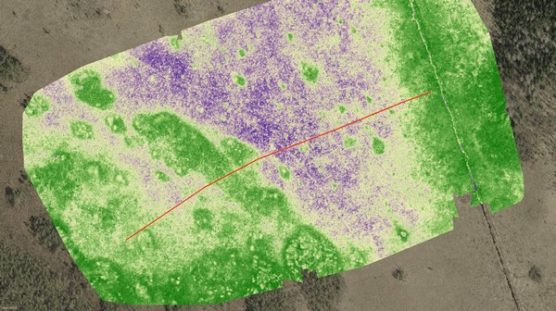
Remotely-sensed image of the area of study transect (red line) cross the Metslõugu ditch in the NE part of the project site. Colours on the map show the vegetation “greenness”. Area was mapped with Parrot Sequoia multispectral camera of SenseFly eBee drone. After mapping Normalized Difference Vegetation Index (NDVI) calculated. Green tones indicate areas with high NDVI value (high “greenness”) and violet tones lowest values. Compiled by Raimo Pajula