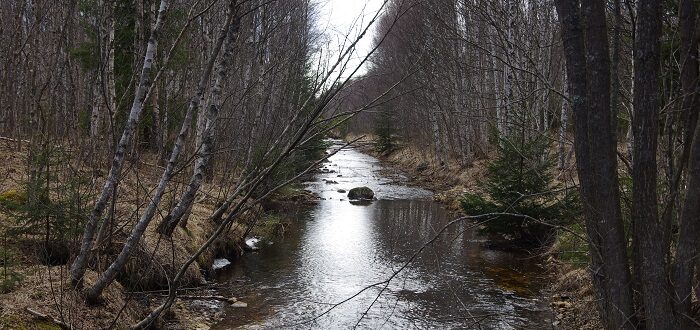
Prior to raising the water level, the levels were studied at 61 measuring stations during the three years in the Suursoo-Leidissoo restoration area on the eastern edge of the Läänemaa Suursoo peatland complex. Automatic water level loggers recorded water levels every hour. The obtained data have now been analysed. Based on this, the picture of water movement and the relationship between water levels and the formed vegetation in this long-drained peatland has become clear.
The Estonian Lexicon of Ecology explains that mire is an area or ecosystem characterised by the “continuous or prolonged, stagnant or slow-flowing high water quantity. The result is the mire-specific vegetation and soil formation. However, when looking for an answer of what indicators can be used to characterise this “stagnant or slow-flowing water”, and whether, for example, the measured groundwater level (GWL) characterise the natural fen, transitional mire or bog or disturbed by the drainage peatland, it turns out that there is no clear answer on that.
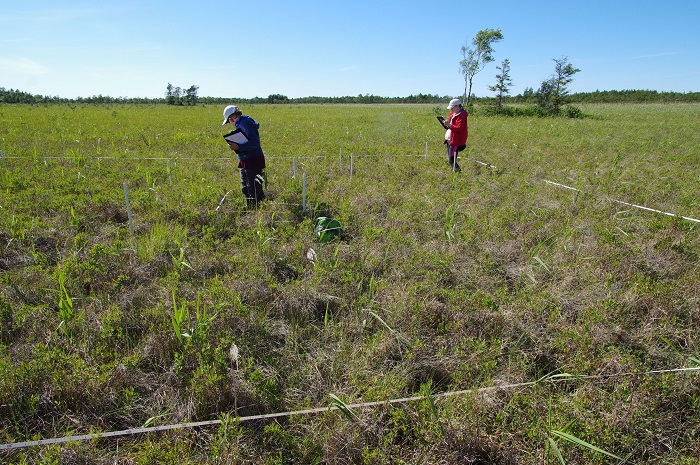
Unique GWL data sequence was collected from 61 GWL measuring stations on Suursoo-Leidissoo restoration site, with a recording density of one hour during the project period of 19/05/2018 – 05/11/2020. Statistical proceeding of collected GWL data based on former daily GWL data matrix, consisting of 48,200 numerical values.
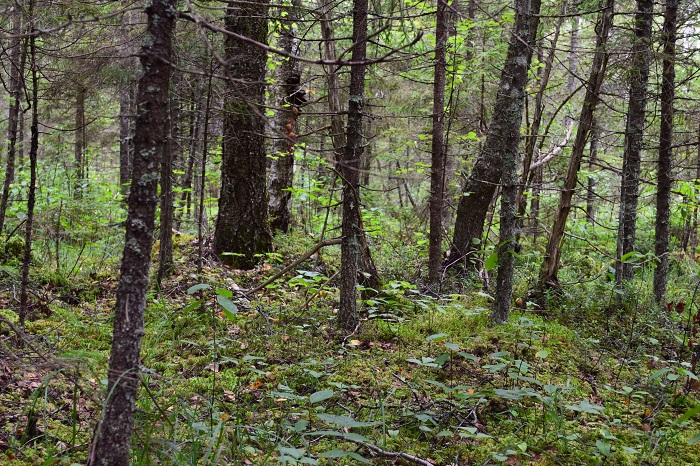
The proceeding of GWL data matrices with different time windows showed that the GWL dynamics of different mire sites within one peatland massif depend on the type of the site cover (e.g. forest, sparse tree stand, shrub cover, open site), the distance between GWL site location and the drainage system, the topography of the disturbed peatland and its adjacent mineral land, and the water feeding system, i.e. the water that keeps the mire area wet.
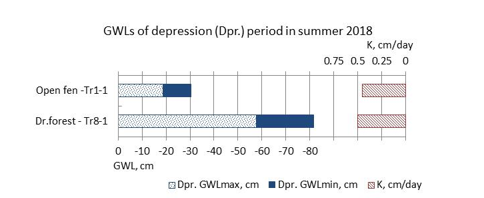
The analysis of GWL dynamics revealed that the “depths” and durations of GWL depression periods (in the warmest time in midsummer) at GWL measurement sites coincided with the summer or hydrological minimum periods in surrounding, but statistical GWL relationships between sites with the same land cover types remained poor, except for the GWL dynamics within open and forested ecotypes.
The amplitude of GWL fluctuation in the best preserved open fen sites ranged within 10 cm in water level of 10 to 30 cm below the soil surface; in forested sites the GWL amplitude ranged between 5 to 20 cm in water level of 50 to 110 cm below the soil surface.
Extension of GIS classified opened and forested land cover on the peatland showed good coincidences with the ground level vegetation mapping, but the areas related to the sparse tree stands and shrubs needed repeated ground level detection work.
In order to assess the actual impact of the drainage blocking to the GWL dynamics on restoration area, the methodology of GWL analysis developed during Life Peat Restore should be applied approximately 4-5 years after the ditch blocking on the area, i.e. after the water environment adaptation period to the drainage blocking.
All analyses are seen in the project reports: https://drive.google.com/drive/folders/1lEtO2M-m71aORT1eRgy9VF1AdjRIx6pL?usp=sharing